

e44 Atlas of Neuroimaging
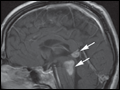
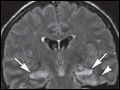 | Figure e44-1 Limbic encephalitis ( |
view large |
 | Figure e44-2 CNS tuberculosis ( Axial T2-weighted MRI (A) demonstrates multiple lesions (arrows) with peripheral high signal and central low signal, located predominantly in the cortex and subcortical... |
view large |
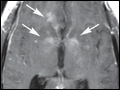
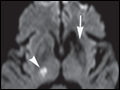
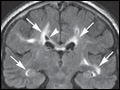
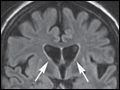
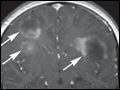
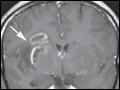 | Figure e44-3 Neurosyphilis ( Case I Axial T2-weighted MR images (A, B) demonstrate well-defined areas of abnormal high signal in the basal... |
view large |
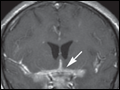
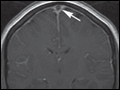
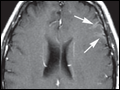
 | Figure e44-4 Neurosyphilis ( Case II Axial T2-weighted MRI (A) demonstrates a dural-based, peripherally hyperintense and centrally hypointense lesion located lateral to the left frontal lobe (arrow). Axial (B) and coronal (C) T1-weighted MR images postgadolinium demonstrate peripheral enhancement of the lesion ( |
view large |
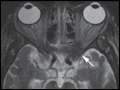
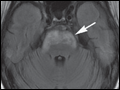
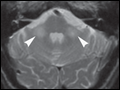
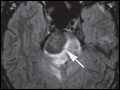 | Figure e44-5 Histoplasmosis of the pons ( Axial FLAIR (A) and T2-weighted (B) MR images demonstrate a low signal mass in the right pons (arrows) with... |
view large |
 | Figure e44-6 Coccidiomycosis meningitis ( Axial postcontrast CT (A) and axial (B) and coronal (C) T1-weighted MR images postgadolinium demonstrate enhancement of the perimesencephalic cisterns (arrows), as well as the sylvian and interhemispheric... |
view large |
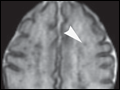 | Figure e44-7 Candidiasis in a newborn ( Axial T2-weighted MR image (A) demonstrates multiple punctate foci of low signal diffusely distributed in the brain parenchyma (arrowhead). Axial T1-weighted... |
view large |
 | Figure e44-8 CNS aspergillosis ( Axial FLAIR MR images (A, B) demonstrate multiple areas of abnormal high signal in the basal ganglia as well as cortex and subcortical white... |
view large |
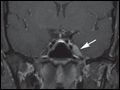
 | Figure e44-9 Invasive sinonasal aspergillosis ( Axial T2-weighted MR image (A) demonstrates an irregularly shaped low signal lesion involving the left orbital apex (arrow). |
view large |
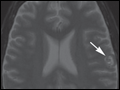
 | Figure e44-10 Behçet's disease ( Axial FLAIR MRI demonstrates abnormal high signal involving the anterior pons (arrow); following gadolinium administration, the lesion was nonenhancing (not shown). Brainstem lesions are typical of Behçet's disease, caused primarily by vasculitis and in some cases demyelinating... |
view large |
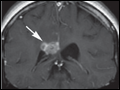
 | Figure e44-11 Neurosarcoid (Chap. 329) Case I Coronal (A) and axial (B) T1-weighted images postgadolinium with fat suppression demonstrate a homogeneously enhancing well-circumscribed mass centered in the left Meckel's cave ( |
view large |
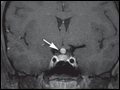
 | Figure e44-12 Neurosarcoid (Chap. 329) Case II Axial (A, B) and sagittal (C) T1-weighted images postgadolinium with fat suppression demonstrate a homogeneously enhancing mass involving the hypothalamus and the pituitary stalk ( |
view large |
 | Figure e44-13 Neurosarcoid ( Case III Axial FLAIR images (A–E) demonstrate abnormal high signal and slight expansion in the midbrain, dorsal pons, and pineal region ( |
view large |
 | Figure e44-14 Neurosarcoid ( Case IV Axial T2-weighted images (A–D) demonstrate numerous areas of abnormal hyperintensity involving the corpus callosum, left internal capsule and globus... |
view large |
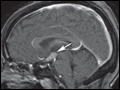
 | Figure e44-15 Histiocytosis ( Sagittal T1-weighted image (A) demonstrates enlargement of the pituitary stalk (arrow) and absence of the posterior pituitary intrinsic T1 hyperintensity (arrowhead). Sagittal and coronal T1-weighted images postgadolinium (B, C) demonstrate enhancement of the pituitary stalk and infundibulum ( |
view large |
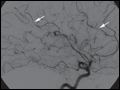
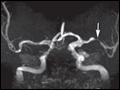 | Figure e44-16 Middle cerebral artery stenosis ( Time-of-flight (TOF) MR angiography (MRA) (A, B) reveals narrowing within the left M1 segment that is likely secondary to atherosclerosis ( |
view large |
 | Figure e44-17 Lacunar infarction ( Axial noncontrast CT (A) demonstrates abnormal hypodensity involving the left anterior putamen and anterior limb of internal capsule with ex-vacuo dilatation of the adjacent frontal horn of the... |
view large |
 | Figure e44-18 Cerebral autosomal dominant arteriopathy with subcortical infarcts and leukoencephalopathy (CADASIL) (Chap. 370) Axial T2-weighted MR images (A, B) demonstrate multiple patchy areas of abnormal high signal in the... |
view large |
 | Figure e44-19 CNS vasculitis ( Axial noncontrast CT (A) demonstrates a large hyperdense intraparenchymal hematoma surrounded by hypodense vasogenic edema in the right parietal lobe. Axial T2-weighted MRI ( |
view large |
 | Figure e44-20 Superior sagittal sinus thrombosis ( Noncontrast CT of the head (A) demonstrates increased density in the superior sagittal sinus, suggestive of thrombosis (arrow), and small linear... |
view large |
 | Figure e44-21 Multiple system atrophy ( Axial T2-weighted MR image (A) reveals symmetric poorly circumscribed abnormal high signal in the middle cerebellar peduncles bilaterally (arrowheads). Sagittal T1-weighted MR image (B) demonstrates pontine atrophy and enlarged cerebellar fissures as a result of cerebellar atrophy ( |
view large |
 | Figure e44-22 Huntington's disease ( Axial noncontrast CT (A) demonstrates symmetric bilateral severe atrophy involving the caudate nuclei, putamen, and globus pallidi bilaterally with consequent enlargement of the frontal horns of... |
view large |
 | Figure e44-23 Bell's palsy ( Axial T1-weighted images postgadolinium with fat suppression (A–C) demonstrate diffuse smooth linear enhancement along the left facial nerve, involving the second and third segments (genu,... |
view large |
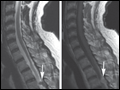
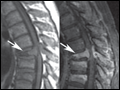
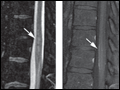 | Figure e44-24 Spinal cord infarction ( Sagittal T2-weighted MR image of the lumbar spine (A) demonstrates poorly defined areas of abnormal high signal in the conus medullaris and mild cord expansion ( |
view large |
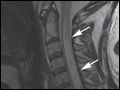 | Figure e44-25 Acute transverse myelitis (Chap. 377) Sagittal T2-weighted MR image (A) demonstrates abnormal high signal in the cervical cord extending from C1 to T1 with associated cord expansion (arrows).... |
view large |
 | Figure e44-26 Acute disseminated encephalomyelitis (ADEM) ( Axial T2-weighted (A) and coronal FLAIR (B) images demonstrate abnormal areas of high signal involving predominantly... |
view large |
 | Figure e44-27 Baló's concentric sclerosis (a variant of multiple sclerosis) ( Coronal FLAIR MRI (A) demonstrates multiple areas of abnormal high signal in the supratentorial white matter bilaterally. The lesions are ovoid in... |
view large |
 | Figure e44-28 Hashimoto's encephalopathy ( Axial FLAIR (A) demonstrates focal area of abnormal high signal involving the gray and white matter in the left frontal lobe. There is also a small area of abnormal high signal in the... |
view large |
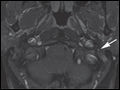
 | Figure e44-29 Brachial plexopathy (Chap. 384) Axial (A), sagittal (B), and coronal (C, D) short tau inversion recov... |
view large |
 | Figure e44-30 Anterior dens dislocation Sagittal CT demonstrates the tip of the dens below the anterior arch of C2 (arrow), indicating anterior dislocation. |
view large |
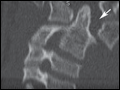
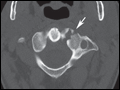 | Figure e44-31 CT facet fracture Axial CT demonstrates fracture line along the C2 facet (arrow). |
view large |
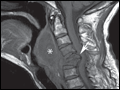
 | Figure e44-32 Compression fracture Sagittal T2-weighted MRI demonstrates compression fracture of C7 (*) and high signal within the spinous processes of C6-C7 (arrows) and to lesser degree C5-C6. This is suggestive of interspinous ligament injury. Note the pad under the patient's neck to maintain neck alignment during the scanning... |
view large |
 | Figure e44-33 Epidural hematoma Axial noncontrast CT (A) demonstrates a high-density epidural collection in the cervical spine (*), which is consistent with acute hemorrhage. Also noted is mass effect on the spinal cord ( |
view large |
 | Figure e44-34 Retropharyngeal soft tissue mass Sagittal T1-weighted MRI demonstrates a hyperflexion fracture with retropulsion of the posterior wall in the canal at C5 and C6 (arrow). There is also a large retropharyngeal hematoma (*). The distance from the posterior wall of the... |
view large |
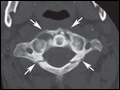 | Figure e44-35 Jefferson fracture Axial CT demonstrates four fracture lines (arrows) separating C1 in four parts. Jefferson fracture is usually caused by axial impact to the head such as diving in shallow water. |
view large |
 | Figure e44-36 Ligament injury after trauma Coronal CT reconstruction demonstrates abnormal asymmetry between the dens and the lateral masses of C1 indicating transverse ligament rupture. |
view large |
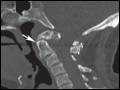
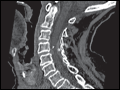
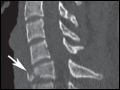
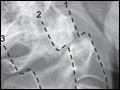 | Figure e44-37 Odontoid fracture Sagittal CT demonstrates disruption of the main reference cervical lines. 1: Anterior vertebral body line; 2: Posterior vertebral body line; 3: Spinolaminar line. |
view large |
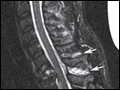
 | Figure e44-38 Pathologic fracture Sagittal T1-weighted MRI (A) demonstrates wedge-shaped T6 vertebral body (arrow). Sagittal postcontrast T1-weighted MRI (B) depicts tumor extension into the epidural space and the involvement of the posterior arch (*), which are highly suggestive of metastatic or primary bone... |
view large |
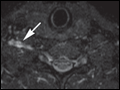
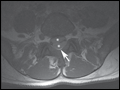
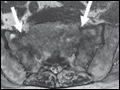 | Figure e44-39 Sacral insufficiency fracture Axial T2-weighted MRI (A) and T1-weighted MRI (B) demonstrate symmetric high T2 and low T1 signal involving the sacral alae longitudinally (arrows). |
view large |
 | Figure e44-40 Subdural hematoma Sagittal T2-weighted MRI (A) and axial noncontrast T1-weighted MRI (B) demonstrate subdural collection in the lumbosacral region (**). Note that the epidural fat is compressed but not involved ( |
view large |
 | Figure e44-41 Teardrop fracture Sagittal CT (A) demonstrates fracture line separating the antero-inferior corner of C6 (arrow). Sagittal T2-weighted MRI (B) displays cord injury ( |
view large |