

PART 10: Disorders of the Cardiovascular System
SECTION 5 Vascular Disease
e33 Atlas of Percutaneous Revascularization
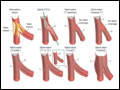 | Figure e33-1 Schematic representation of 1-stent and 2-stent techniques to treat bifurcation lesions. PTCA, Percutaneous transluminal coronary angioplasty. (Reprinted with permission from SK Sharma, A Kini: Cardiol Clin 24:233, 2006.) |
view large |
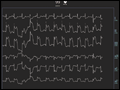 | Figure e33-2 Pre-procedure ECG showing inferior ST-segment elevations and lateral ST-segment depressions. |
view large |
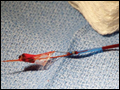
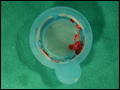 | Figure e33-3 Example of an organized red thrombus retrieved by manual thrombectomy. (Reprinted with permission from C Trani et al: J Invasive Cardiol 19:E317, 2007.) |
view large |
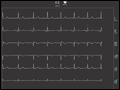 | Figure e33-4 Post-procedure ECG showing resolution of ST-segment elevations. |
view large |
 | Figure e33-5 Distal protection device showing captured atherosclerotic debris liberated by initial balloon dilation. (Reprinted with permission from RA Aqel et al: J Invasive Cardiol 19:E104, 2007.) |
view large |
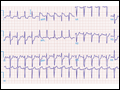 | Figure e33-6 During chest pain, the ECG showed diffuse ST-segment depression of up to 5 mm in the inferior and lateral leads. |
view large |
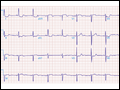 | Figure e33-7 Following resolution of the chest pain, the ST-segment depression is less marked. |
view large |
 | Figure e33-8 Optical coherence tomography image following initial balloon dilation. Residual thrombus that is adherent to the stent struts is seen. (Reprinted with permission from AF Schinkel et al: JACC Cardiovasc Interv 1:449, 2008.) |
view large |
 | Figure e33-9 Pathologic specimen of late stent thrombosis obtained at autopsy. Thrombus is seen filling the LAD vessel lumen and extending into a diagonal branch (LD). Stent struts occupied the space denoted by asterisk (*) (left). A magnified view of the vessel reveals thrombus around the stent strut and neointima formation ( |
view large |
 | Figure e33-10 Transesophageal echocardiogram shows a calcified trileaflet aortic valve (A) with reduced leaflet excursion and a narrowed orifice in peak systole (B). |
view large |
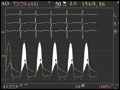 | Figure e33-11 Hemodynamically significant aortic (AO) stenosis. Simultaneous recording of AO and left ventricle (LV) pressures shows an 82 mmHg peak-to-peak gradient and a 63.3 mmHg mean gradient between the LV (154/9 mmHg) and AO (72/29 mmHg) pressures. This is consistent with an aortic valve area of 0.58 cm2. |
view large |
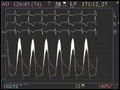 | Figure e33-12 After balloon valvuloplasty, the LV–AO mean pressure gradient decreased to 37.3 mmHg, indicating that the aortic valve area increased to 0.95 cm2. |
view large |
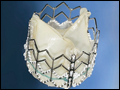 | Figure e33-13 The Edwards SAPIEN Transcatheter Heart Valve. (Reprinted with permission from A Zajarias and A Cribier: JACC 53:1829, 2009.) |
view large |
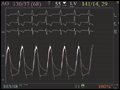 | Figure e33-14 Once the valve was deployed, the pressure gradient between the LV and AO decreased to 11.6 mmHg and the functional valve area is 1.34 cm2. |
view large |
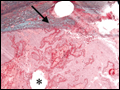
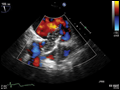
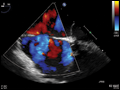 | Figure e33-15 Transesophageal echocardiogram of a secundum ASD. The ASD is seen as "dropout" in the interatrial septum between the left atrium (LA) and RA (A). Doppler color flow imaging shows blue in the RA consistent with left-to-right flow (B). |
view large |
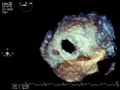 | Figure e33-16 Three-dimensional echocardiographic reconstruction of the secundum ASD. The ASD is round and has an acceptable margin of tissue to seat a septal occluder device. |
view large |
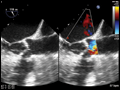
 | Figure e33-17 Transesophageal echocardiogram showing sizing balloon (A) and no flow (B) across the atrial septal defect. |
view large |
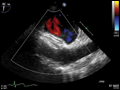 | Figure e33-18 Amplatzer septal occluder in place (A). There is no blood flow across the device (B). |
view large |
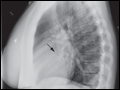 | Figure e33-19 Postprocedure lateral chest x-ray showing the Amplatzer septal occluder in place. |
view large |