

PART 10: Disorders of the Cardiovascular System
SECTION 2 Diagnosis of Cardiovascular Disorders
e29 Atlas of Noninvasive Cardiac Imaging
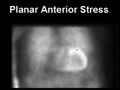 | Figure e29-1 Anterior planar thallium images following stress, showing increased lung uptake on the left (count intensity in lung >50% of that in myocardium) and normal lung uptake on the right (count intensity in lung <50% of that in myocardium). Increased lung uptake of thallium may be seen immediately after stress. It reflects... |
view large |
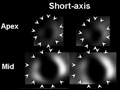 | Figure e29-2 Exercise SPECT 99mTc sestamibi scan in a 64-year-old male patient with a previous infarct. The stress images (left) show a large defect involving the apex, anterior, septal, and inferior walls (arrowheads) with little change from the rest images (right), signifying a fixed defect consistent... |
view large |
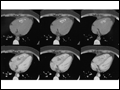
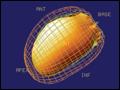 | Figure e29-3 Mesh cinegraphic display of images obtained from electrocardiographic gating of a SPECT 99mTc sestamibi scan in a 64-year-old male patient with a previous infarct (same patient as in |
view large |
 | Figure e29-4 Adenosine PET N-13 ammonia in a 55-year-old obese male patient with typical angina. The stress images (left) show a large defect involving the apex, anterior, septal, inferior, and lateral walls (arrowhead) with normal or near-normal tracer uptake in the corresponding regions... |
view large |
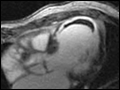
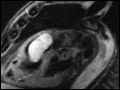 | Figure e29-5 MR image of a patient with a right ventricular myxoma, which is shown as a bright oblong structure in the right ventricular outflow tract. |
view large |
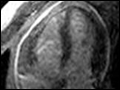
 | Figure e29-6 MR image with contrast enhancement of a patient with a large apical aneurysm and thrombus. Imaging the heart 10-20 min after gadolinium injection demonstrates enhancement of the infarcted tissue (visible as dense white image). The infarcted tissue retains contrast by virtual of its large extracellular volume. The left ventricular thrombus adherent to the... |
view large |
 | Figure e29-7 MR images with contrast enhancement in a patient with acute pericarditis. In the presence of pericardial inflammation, the gadolinium enhancement occurs, seen as a white layer in the pericardium. |
view large |
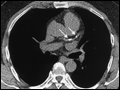
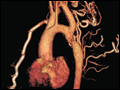 | Figure e29-8 Three-dimensional reconstruction of a CT angiogram, showing a severe coarctation of the descending aorta. The large collateral vessels are the result of the severe stenosis of the distal thoracic aorta. |
view large |
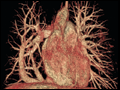 | Figure e29-9 Three-dimensional reconstruction of a CT angiogram of the pulmonary veins, demonstrating an anomalous pulmonary venous drainage into the inferior vena cava. A.: frontal view. B.: posterior view. |
view large |
 | Figure e29-10 Cardiac CT images demonstrating a calcified mass in the right ventricle, which at pathologic examination was a chronic thrombus. Calcification is seen as a bright signal in both the noncontrast (upper) and contrast-enhanced (lower) images. |
view large |
 | Figure e29-11 Noncontrast image from an electron beam CT revealing two small foci of calcification in the left anterior descending artery (arrows). |
view large |
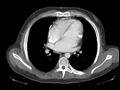 | Figure e29-12 CT image from a patient with calcific constrictive pericarditis. Calcification is seen as a bright signal in the anterior pericardium as well as calcification extending into the lateral wall of the left ventricle. |
view large |
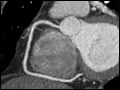 | Figure e29-13 A reconstructed CT coronary angiogram showing a normal right coronary artery. |
view large |
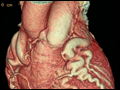 | Figure e29-14 Three-dimensional reconstruction of a CT angiogram showing a large fistula of the left anterior descending artery. |
view large |
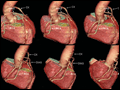 | Figure e29-15 Three-dimensional reconstruction of a CT angiogram demonstrating three saphenous vein coronary artery bypass grafts in different views. In the upper left-hand panel is an anterior posterior view of the heart and grafts. The heart is sequentially rotated clockwise in the panels going from left to right to illustrate the ability of CT angiography to... |
view large |