

PART 10: Disorders of the Cardiovascular System
SECTION 2 Diagnosis of Cardiovascular Disorders
e28 Atlas of Electrocardiography
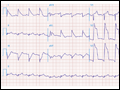
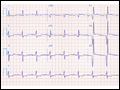
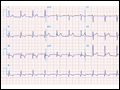
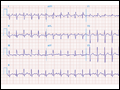
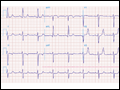
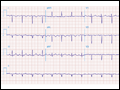
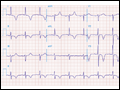 | Figure e28-1 Anterior wall ischemia (deep T-wave inversions and ST-segment depressions in I, aVL, V3−V6) in a patient with LVH (increased voltage in V2−V5). |
view large |
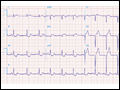
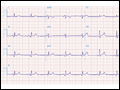
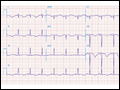
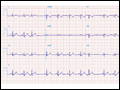
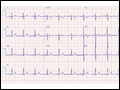
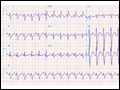
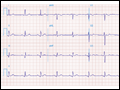 | Figure e28-2 Acute anterolateral wall ischemia with ST elevations in V4−V6. Probable prior inferior MI with Q waves in leads II, III, and aVF. |
view large |
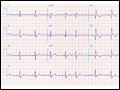
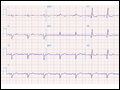
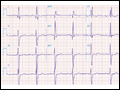
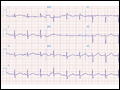
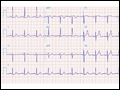
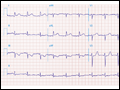 | Figure e28-3 Acute lateral ischemia with ST elevations in I and aVL with probable reciprocal ST depressions inferiorly (II, III, and aVF). Ischemic ST depressions also in V3 and V4. Left atrial abnormality. |
view large |
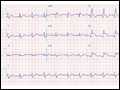
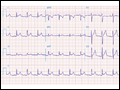
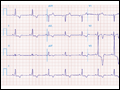
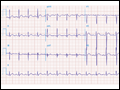
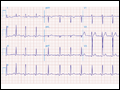
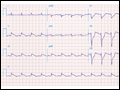 | Figure e28-4 Sinus tachycardia. Marked ischemic ST-segment elevations in inferior limb leads (II, III, aVF) and laterally (V6) suggestive of acute inferolateral MI, and prominent ST-segment depressions with upright T waves in V1−V4 are consistent with associated acute posterior... |
view large |
 | Figure e28-5 Acute, extensive anterior MI with marked ST elevations in I, aVL, V1−V6 and small pathologic Q waves in V3−V6. Marked reciprocal ST-segment depressions in III and aVF. |
view large |
 | Figure e28-6 Acute anterior wall MI with ST elevations and Q waves in V1−V4 and aVL and reciprocal inferior ST depressions. |
view large |
 | Figure e28-7 NSR with premature atrial complexes. RBBB; pathologic Q waves and ST elevation due to acute anterior/septal MI in V1−V3. |
view large |
 | Figure e28-8 Acute anteroseptal MI (Q waves and ST elevations in V1−V4) with RBBB (note terminal R waves in V1). |
view large |
 | Figure e28-9 Extensive prior MI involving inferior-posterior-lateral wall (Q waves in leads II, III, aVF, tall R waves in V1, V2, and Q waves in V5, V6). T-wave abnormalities in leads I and aVL, V5, and V6. |
view large |
 | Figure e28-10 NSR with PR prolongation ("1st degree AV block"), left atrial abnormality, LVH, and RBBB. Pathologic Q waves in V1−V5 and aVL with ST elevations (a chronic finding in this patient). Findings compatible with prior anterolateral MI and LV aneurysm. |
view large |
 | Figure e28-11 Prior inferior-posterior MI. Wide (0.04 s) Q waves in the inferior leads (II, III, aVF); broad R wave in V1 (a Q wave "equivalent" here). Absence of right-axis deviation and the presence of upright T waves in V1−V2 are also against RVH. |
view large |
 | Figure e28-12 NSR with RBBB (broad terminal R wave in V1) and left anterior fascicular block (hemiblock) and pathologic anterior Q waves in V1−V3. Patient had severe multivessel coronary artery disease, with echocardiogram showing septal dyskinesis and apical akinesis. |
view large |
 | Figure e28-13 Acute pericarditis with diffuse ST elevations in I, II, III, aVF, V3−V6, without T-wave inversions. Also note concomitant PR-segment elevation in aVR and PR depression in the inferolateral leads. |
view large |
 | Figure e28-14 Sinus rhythm; diffuse ST elevations (I, II, aVL, aVF, V2−V6) with associated PR deviations (elevated PR in aVR; depressed in V4−V6); borderline low voltage. Q-wave and T-wave inversions in II, III, and aVF. Diagnosis: acute pericarditis with inferior Q-wave MI. |
view large |
 | Figure e28-15 NSR, prominent left atrial abnormality (see I, II, V1), right-axis deviation and RVH (tall, relatively narrow R wave in V1) in a patient with mitral stenosis. |
view large |
 | Figure e28-16 NSR, left atrial abnormality, and LVH by voltage criteria with borderline right-axis deviation in a patient with mixed mitral stenosis (left atrial abnormality and right-axis deviation) and mitral regurgitation (LVH). Prominent precordial T-wave inversions and QT prolongation also present. |
view large |
 | Figure e28-17 Coarse AF, tall R in V2 with vertical QRS axis (positive R in aVF) indicating RVH. Tall R in V4 may be due to concomitant LVH. Patient had severe mitral stenosis with moderate mitral regurgitation. |
view large |
 | Figure e28-18 NSR; first-degree A-V "block" (P-R prolongation); LVH (tall R in aVL); RBBB (wide multiphasic R wave in V1) and left anterior fascicular block in a patient with HCM. Deep Q waves in I and aVL are consistent with septal hypertrophy. |
view large |
 | Figure e28-19 LVH with deep T-wave inversions in limb leads and precordial leads. Striking T-wave inversions in mid-precordial leads suggest apical HCM (Yamaguchi's syndrome). |
view large |
 | Figure e28-20 Sinus tachycardia with S1Q3T3 pattern (T-wave inversion in III), incomplete RBBB, and right precordial T-wave inversions consistent with acute RV overload in a patient with pulmonary emboli. |
view large |
 | Figure e28-21 Sinus tachycardia, right-axis deviation, RVH with tall R in V1 and deep S in V6 and inverted T waves in II, III, aVF, and V1−V5 in a patient with atrial septal defect and severe pulmonary hypertension. |
view large |
 | Figure e28-22 Signs of right atrial/RV overload in a patient with chronic obstructive lung disease: (1) peaked P waves in II; (2) QR in V1 with narrow QRS; (3) delayed precordial transition, with terminal S waves in V5/V6; (4) superior axis deviation with an S1-S2-S3 pattern. |
view large |
 | Figure e28-23 (1) Low voltage; (2) incomplete RBBB (rsr' in V1−V3); (3) borderline peaked P waves in lead II with vertical P-wave axis (probable right atrial overload); (4) slow R-wave progression in V1−V3; (5) prominent S waves in V6; and (6) atrial premature beats. This combination is seen typically in severe chronic obstructive lung... |
view large |
 | Figure e28-24 Prominent U waves (II, III, and V4−V6) with ventricular repolarization prolongation in a patient with severe hypokalemia. |
view large |
 | Figure e28-25 Abbreviated ST segment such that the T wave looks like it takes off directly from QRS in some leads (I, V4, aVL, and V5) in a patient with severe hypercalcemia. Note also high takeoff of ST segment in V2/V3 simulating acute ischemia. |
view large |
 | Figure e28-26 NSR with LVH, left atrial abnormality, and tall peaked T waves in the precordial leads with inferolateral ST depressions (II, III, aVF, and V6); left anterior fascicular block and borderline prolonged QT interval in a patient with renal failure, hypertension, and hyperkalemia; prolonged QT is secondary to associated... |
view large |
 | Figure e28-27 Normal ECG in an 11-year-old male. T-wave inversions in V1−V2. Vertical QRS axis (+90°) and early precordial transition between V2 and V3 are normal findings in children. |
view large |
 | Figure e28-28 Left atrial abnormality and LVH in a patient with long-standing hypertension. |
view large |
 | Figure e28-29 Normal variant ST-segment elevations in a healthy 21-year-old male (commonly referred to as benignearly repolarization pattern). ST elevations exhibit upward concavity and are most apparent in V3 and V4, and less than 1 mm in the limb leads. Precordial QRS voltages are prominent, but... |
view large |
 | Figure e28-30 NSR with first-degree AV "block" (PR interval = 0.24 s) and complete left bundle branch block. |
view large |
 | Figure e28-31 Dextrocardia with: (1) inverted P waves in I and aVL; (2) negative QRS complex and T wave in I; and (3) progressively decreasing voltage across the precordium. |
view large |
 | Figure e28-32 Sinus tachycardia; intraventricular conduction delay (IVCD) with a rightward QRS axis. QT interval is prolonged for the rate. The triad of sinus tachycardia, a wide QRS complex, and a long QT in appropriate clinical context suggests tricyclic antidepressant overdose. Terminal S wave (rS) in I, and terminal R wave (qR) in aVR are... |
view large |