

PART 3: Genes, the Environment, and Disease
e19 Systems Biology in Health and Disease
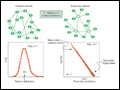 | Figure e19-1 Network representations and their distributions. A random network is depicted on the left, and its Poisson distribution of the number of nodal connections (k) is shown in the graph below it. A scale-free network is depicted on the right, and its power law distribution of the number of nodal connections (k) is shown in the graph... |
view large |
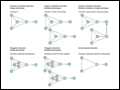 | Figure e19-2 Examples of modular representations of human disease. G, primary human disease genome or proteome; D, secondary human disease genome or proteome; E, environmental determinants; I, intermediate phenotype; P, pathophenotype. (Reproduced with permission from Loscalzo et al.) |
view large |
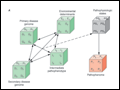 | Figure e19-3 A. Theoretical human disease network illustrating the relationships among genetic and environmental determinants of the pathophenotypes. Key: G, primary disease genome or proteome; D, secondary disease genome or proteome; I, intermediate phenotype; E, environmental... |
view large |
 | Figure e19-4 A. Human disease network. Each node corresponds to a specific disorder colored by class (22 classes, shown in the key to B). The size of each node is proportional to the number of genes contributing to the disorder.... |
view large |