

PART 17: Neurologic Disorders
SECTION 2 Diseases of the Central Nervous System
370 Cerebrovascular Diseases
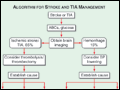 | Figure 370-1 Medical management of stroke and TIA. Rounded boxes are diagnoses; rectangles are interventions. Numbers are percentages of stroke overall. ABCs, airway, breathing, circulation; BP, blood pressure; CEA, carotid endarterectomy; ICH, intracerebral hemorrhage; SAH, subarachnoid hemorrhage;... |
view large |
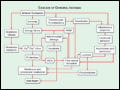 | Figure 370-2 Major steps in the cascade of cerebral ischemia. See text for details. iNOS, inducible nitric oxide synthase; PARP, poly-A ribose polymerase. |
view large |
 | Figure 370-3 Pathophysiology of ischemic stroke. A. Diagram illustrating the three major mechanisms that underlie ischemic stroke: (1) occlusion of an intracranial vessel by an embolus that arises at a distant site (e.g., cardiogenic sources such as atrial fibrillation or... |
view large |
 | Figure 370-4 Diagrams and reformatted CT angiograms in the coronal section illustrating the deep penetrating arteries involved in small-vessel strokes. In the anterior circulation, small penetrating arteries called lenticulostriates arise from the proximal portion of the... |
view large |
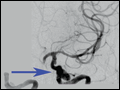
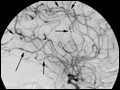 | Figure 370-5 Cerebral angiogram from a 32-year-old male with central nervous system vasculopathy. Dramatic beading (arrows) typical of vasculopathy is seen. |
view large |
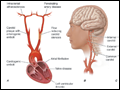
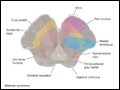
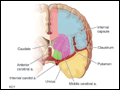 | Figure 370-6 Diagram of a cerebral hemisphere in coronal section showing the territories of the major cerebral vessels that branch from the internal carotid arteries. |
view large |
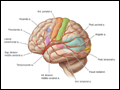 | Figure 370-7 Diagram of a cerebral hemisphere, lateral aspect, showing the branches and distribution of the middle cerebral artery and the principal regions of cerebral localization. Note the bifurcation of the middle cerebral artery into a superior and inferior division....
|
view large |
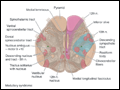
 | Figure 370-8 Diagram of a cerebral hemisphere, medial aspect, showing the branches and distribution of the anterior cerebral artery and the principal regions of cerebral localization.... |
view large |
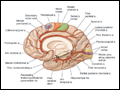
 | Figure 370-9 Inferior aspect of the brain with the branches and distribution of the posterior cerebral artery and the principal anatomic structures shown.... |
view large |
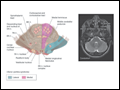
 | Figure 370-10 Axial section at the level of the medulla, depicted schematically on the left, with a corresponding MR image on the right. Note that in Figs. 370-10 through 370-14, all drawings are oriented with the dorsal surface at the bottom, matching the orientation of the brainstem that is commonly... |
view large |
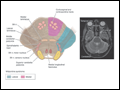
 | Figure 370-11 Axial section at the level of the inferior pons, depicted schematically on the left, with a corresponding MR image on the right. Approximate regions involved in medial and lateral inferior pontine stroke syndromes are shown.... |
view large |
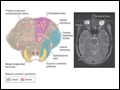
 | Figure 370-12 Axial section at the level of the midpons, depicted schematically on the left, with a corresponding MR image on the right. Approximate regions involved in medial and lateral midpontine stroke syndromes are shown.... |
view large |
 | Figure 370-13 Axial section at the level of the superior pons, depicted schematically on the left, with a corresponding MR image on the right. Approximate regions involved in medial and lateral superior pontine stroke syndromes are shown.... |
view large |
 | Figure 370-14 Axial section at the level of the midbrain, depicted schematically on the left, with a corresponding MR image on the right. Approximate regions involved in medial and lateral midbrain stroke syndromes are shown.... |
view large |
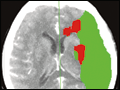 | Figure 370-15 Acute left middle cerebral artery (MCA) stroke with right hemiplegia but preserved language. A. CT perfusion mean-transit time map showing delayed perfusion of the left MCA distribution (blue). B. Predicted region of infarct (red) and penumbra (green) based on... |
view large |
 | Figure 370-16 MRI of acute stroke. A. MRI diffusion-weighted image (DWI) of an 82-year-old woman 2.5 hours after onset of right-sided weakness and aphasia reveals restricted diffusion within the left basal ganglia and internal capsule (colored regions.) B. Perfusion defect within the left hemisphere... |
view large |
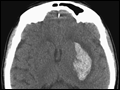 | Figure 370-17 Hypertensive hemorrhage. Transaxial noncontrast CT scan through the region of the basal ganglia reveals a hematoma involving the left putamen in a patient with rapidly progressive onset of right hemiparesis. |
view large |