

PART 14: Disorders of the Gastrointestinal System
SECTION 2 Liver and Biliary Tract Disease
306 Chronic Hepatitis
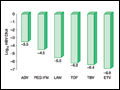 | Figure 306-1 Relative potency of antiviral drugs for hepatitis B, as reflected by median log10 HBV DNA reduction in HBeAg-positive chronic hepatitis B. These data are from individual reports of large, randomized controlled registration trials that were the basis for approval of the drugs. In... |
view large |
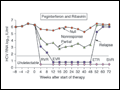 | Figure 306-2 Virologic responses during a 48-week course of antiviral therapy in patients with hepatitis C, genotype 1 or 4 (for genotypes 2 or 3, the course would be 24 weeks). Nonresponders can be classified as null responders (HCV RNA reduction of <2 log10 IU/ml) or partial responders... |
view large |
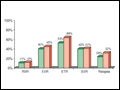 | Figure 306-3 Head-to-head comparison of standard-dose PEG IFN α-2b 1.5 μg/kg weekly and PEG IFN α-2a 180 μg weekly administered with daily ribavirin in the “IDEAL” trial. Percent achieving treatment milestones for PEG IFN α-2b (green boxes) and PEG IFN α-2a... |
view large |