

PART 11: Disorders of the Respiratory System
SECTION 1 Diagnosis of Respiratory Disorders
252 Disturbances of Respiratory Function
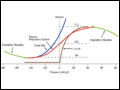 | Figure 252-1 Pressure-volume curves of the isolated lung, isolated chest wall, combined respiratory system, inspiratory muscles, and expiratory muscles. FRC, functional residual capacity; RV, residual volume; TLC, total lung capacity. |
view large |
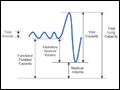 | Figure 252-2 Spirogram demonstrating a slow vital capacity maneuver and various lung volumes. |
view large |
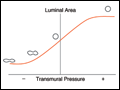 | Figure 252-3 Luminal area versus transmural pressure relationship. Transmural pressure represents the pressure difference across the airway wall from inside to outside. |
view large |
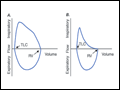 | Figure 252-4 Flow-volume loops. A. Normal. B. Airflow obstruction. C. Fixed central airway obstruction. RV, residual volume; TLC, total lung capacity. |
view large |
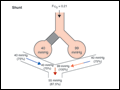 | Figure 252-5 Influence of air vs oxygen breathing on mixed arterial oxygenation in shunt and ventilation/perfusion heterogeneity. Partial pressure of oxygen (mmHg) and oxygen saturations are shown for mixed venous blood, end capillary blood for normal versus affected alveoli, and for mixed... |
view large |
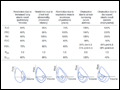 | Figure 252-6 Commonly seen abnormalities of pulmonary function (see text). Pulmonary function values are expressed as percent of normal predicted values, except for Raw, which is expressed as cmH2O/L/s (normal <2 cmH2O/L/s). The figures at the bottom of each... |
view large |