

PART 10: Disorders of the Cardiovascular System
SECTION 2 Diagnosis of Cardiovascular Disorders
229 Noninvasive Cardiac Imaging: Echocardiography, Nuclear Cardiology, and MRI/CT Imaging
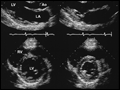 | Figure 229-1 Two-dimensional echocardiographic still-frame images from a normal patient with a normal heart. Upper: Parasternal long-axis view during systole and diastole (left) and systole (right). During systole, there is thickening of the myocardium... |
view large |
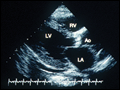 | Figure 229-2 Two-dimensional echocardiographic still-frame images from a patient with aortic stenosis. Parasternal long-axis view shows a heavily calcified aortic valve. RV, right ventricle; LV, left ventricle; AO, aorta; LA, left ... |
view large |
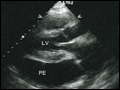 | Figure 229-3 Two-dimensional echocardiographic still-frame image of a patient with a pericardial effusion. Pericardial effusion (PE) is shown as black echo-free space surrounding the heart. LV, left ventricle. |
view large |
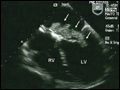 | Figure 229-4 Transesophageal still-frame echocardiographic images of a patient with a left atrial myxoma. There is a large echo-dense mass in the left atrium, attached to the atrial septum. The mass moves across the mitral valve in diastole. LV, left ventricle; RV, right ventricle. |
view large |
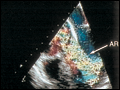 | Figure 229-5 Transesophageal still-frame echocardiographic view of a patient with a dilated aorta, aortic dissection, and severe aortic regurgitation. The arrow points to the intimal flap that is seen in the dilated ascending aorta. Left: The long-axis apex-down view of the black-and-white... |
view large |
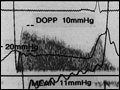 | Figure 229-6 Continuous-wave Doppler of mitral valve velocities in a patient with mitral stenosis. The mean gradient calculated from Doppler (DOPP) of 10 mmHg is similar to the mean gradient of 11 mmHg from simultaneous cardiac catheterization in this patient. |
view large |
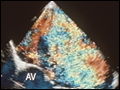 | Figure 229-7 Left: Transesophageal echocardiographic view of a patient with severe mitral regurgitation due to a flail posterior leaflet. The arrow points to the portion of the posterior leaflet that is unsupported and moves into the left atrium during systole. Right: Color-flow imaging demonstrating a large mosaic jet of... |
view large |
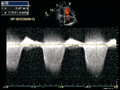 | Figure 229-8 Continuous-wave Doppler of tricuspid regurgitation in a patient with pulmonary hypertension. There is an increase in the velocity to 5.4 m/s. Using the modified Bernoulli equation, the peak pressure gradient between right ventricle and right atrium during systole is 116 mmHg. Assuming a right atrial pressure of 10... |
view large |
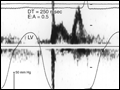 | Figure 229-9 High-fidelity left ventricular (LV) pressure curves superimposed on a mitral inflow velocity curve obtained by Doppler echocardiography. The ratio of early and late diastolic flows is termed the E:A ratio. The deceleration time (DT) measures the rate of decline of early velocity and reflects the effective operative... |
view large |
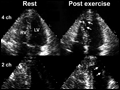 | Figure 229-10 Systolic still-frame two-dimensional echocardiographic images of a patient undergoing a stress echocardiogram. During rest (left), there is contraction of all segments of the myocardium. During exercise (right), there are regional wall... |
view large |
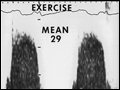 | Figure 229-11 Continuous-wave Doppler echocardiogram across the mitral valve of a patient with mitral stenosis. In the resting state (left), there is a mean gradient of 8 mmHg. During exercise (right), the mean gradient rises to 29 mmHg, indicating a... |
view large |
 | Figure 229-12 Exercise technetium-99m sestamibi images in a 65-year-old man with atypical angina. Images are shown in three standard views; stress (left) and rest (right) in each panel. There is uniform tracer uptake throughout the left ventricular... |
view large |
 | Figure 229-13 Exercise technetium-99m sestamibi and rest thallium-201 images in a 72-year-old woman with typical angina. Images are shown in three standard views, with stress (left) and rest (right) in each panel. Stress images demonstrate reduced tracer... |
view large |
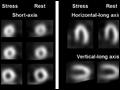
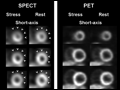 | Figure 229-14 SPECT and PET images in a 67-year-old woman with atypical angina. Images are shown in short-axis views, with stress (left) and rest (right) in each panel. Shifting breast position between the rest and stress SPECT acquisitions produced an... |
view large |
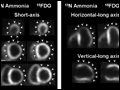 | Figure 229-15 PET viability study in a 63-year-old woman with heart failure, severe LV systolic dysfunction, and severe coronary artery disease. Images are shown in three standard views, with perfusion (left) and glucose metabolism (right) in each panel.... |
view large |
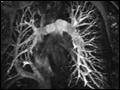 | Figure 229-16 MRA scan of a patient with partial anomalous pulmonary venous drainage of the right lung into the inferior vena cava (scimitar syndrome). MRA is able to define the abnormal anatomic relationships of cardiac structures and great vessels in patients with congenital heart disease. |
view large |
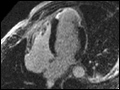
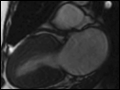 | Figure 229-17 MRI scan of a patient with hypertrophic cardiomyopathy, showing the severe increase in left ventricular wall thickness. Cardiac MRI is an ideal imaging modality for diagnosing cardiomyopathies. |
view large |
 | Figure 229-18 MRI scan with delayed gadolinium enhancement in a patient with a large anteroapical infarction. The gadolinium (white area) accumulated in the extracellular space in the presence of cell death from myocardial infarction. |
view large |
 | Figure 229-19 Left: Normal delayed enhancement and "edema"-sensitive images. Top (left): Delayed enhancement image illustrating normal black myocardium without infarction/fibrosis. Bottom (left): A triple inversion... |
view large |
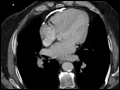 | Figure 229-20 CT scan showing pericardial calcification, seen as a white linear density anterior to the myocardium. |
view large |
 | Figure 229-21 CT scans of three patients showing the ability to detect coronary calcification. Left: Normal coronary arteries without calcification. Middle: Calcification in the left anterior artery (LAD). Right:... |
view large |
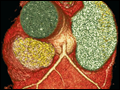 | Figure 229-22 Three-dimensional volume rendered image of a contrastenhanced CT angiogram demonstrating a normal left main coronary artery arising from the aorta and its two branches, the left anterior descending artery (left) and the circumflex artery (right... |
view large |
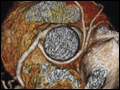 | Figure 229-23 Three-dimensional volume rendered image of a contrastenhanced CT angiogram illustrating an anomalous left coronary artery arising from the right coronary artery and traveling posterior to the aorta. |
view large |
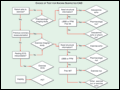 | Figure 229-24 Flow diagram showing selection of initial stress test in a patient with chest pain. Patients who are able to exercise, without previous revascularization, and with an interpretable resting ECG can be tested with an exercise ECG. The appropriate imaging study for other patients depends on multiple factors (see text).... |
view large |