

PART 10: Disorders of the Cardiovascular System
SECTION 2 Diagnosis of Cardiovascular Disorders
228 Electrocardiography
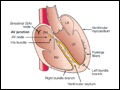 | Figure 228-1 Schematic of the cardiac conduction system. |
view large |
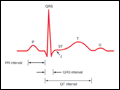 | Figure 228-2 Basic ECG waveforms and intervals. Not shown is the R-R interval, the time between consecutive QRS complexes. |
view large |
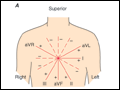 | Figure 228-3 The six frontal plane (A) and six horizontal plane (B) leads provide a three-dimensional representation of cardiac electrical activity. |
view large |
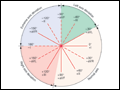 | Figure 228-4 The frontal plane (limb or extremity) leads are represented on a hexaxial diagram. Each ECG lead has a specific spatial orientation and polarity. The positive pole of each lead axis (solid line) and the negative pole (hatched line) are designated by their angular position relative to... |
view large |
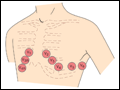 | Figure 228-5 The horizontal plane (chest or precordial) leads are obtained with electrodes in the locations shown. |
view large |
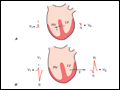 | Figure 228-6 Ventricular depolarization can be divided into two major phases, each represented by a vector. A. The first phase (arrow 1) denotes depolarization of the ventricular septum, beginning on the left side... |
view large |
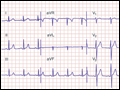 | Figure 228-7 Normal electrocardiogram from a healthy subject. Sinus rhythm is present with a heart rate of 75 beats per minute. PR interval is 0.16 s; QRS interval (duration) is 0.08 s; QT interval is 0.36 s; QTc is 0.40 s; the mean QRS axis is about +70°. The precordial leads... |
view large |
 | Figure 228-8 Right atrial (RA) overload may cause tall, peaked P waves in the limb or precordial leads. Left atrial (LA) abnormality may cause broad, often notched P waves in the limb leads and a biphasic P wave in lead V1 with a prominent negative component representing delayed... |
view large |
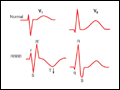
 | Figure 228-9 Left ventricular hypertrophy (LVH) increases the amplitude of electrical forces directed to the left and posteriorly. In addition, repolarization abnormalities may cause ST-segment depression and T-wave inversion in leads with a prominent R wave. Right ventricular hypertrophy... |
view large |
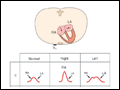
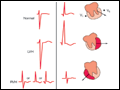
 | Figure 228-10 Comparison of typical QRS-T patterns in right bundle branch block (RBBB) and left bundle branch block (LBBB) with the normal pattern in leads V1 and V6. Note the secondary T-wave inversions (arrows) in leads with an... |
view large |
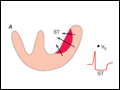 | Figure 228-11 Acute ischemia causes a current of injury. With predominant subendocardial ischemia (A), the resultant ST vector will be directed toward the inner layer of the affected ventricle and the ventricular... |
view large |
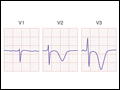 | Figure 228-12 Severe anterior wall ischemia (with or without infarction) may cause prominent T-wave inversions in the precordial leads. This pattern (sometimes referred to as Wellens T waves) is usually associated with a high-grade stenosis of the left anterior descending coronary artery. |
view large |
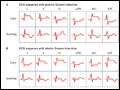 | Figure 228-13 Sequence of depolarization and repolarization changes with (A) acute anterior and (B) acute inferior wall Q-wave infarctions.... |
view large |
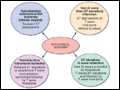 | Figure 228-14 Variability of ECG patterns with acute myocardial ischemia. The ECG also may be normal or nonspecifically abnormal. Furthermore, these categorizations are not mutually exclusive. (After Goldberger, 2006.) |
view large |
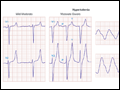 | Figure 228-15 The earliest ECG change with hyperkalemia is usually peaking ("tenting") of the T waves. With further increases in the serum potassium concentration, the QRS complexes widen, the P waves decrease in amplitude and may disappear, and finally a sine-wave pattern leads to asystole... |
view large |
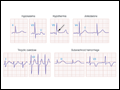 | Figure 228-16 A variety of metabolic derangements, drug effects, and other factors may prolong ventricular repolarization with QT prolongation or prominent U waves. Prominent repolarization prolongation, particularly if due to hypokalemia, inherited "channelopathies," or certain pharmacologic... |
view large |
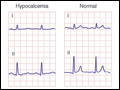 | Figure 228-17 Prolongation of the Q-T interval (ST-segment portion) is typical of hypocalcemia. Hypercalcemia may cause abbreviation of the ST segment and shortening of the QT interval. |
view large |