

PART 10: Disorders of the Cardiovascular System
SECTION 2 Diagnosis of Cardiovascular Disorders
227 Physical Examination of the Cardiovascular System
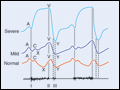 | Figure 227-1 A. Jugular venous pulse wave tracing (top) with heart sounds (bottom). The A wave represents right atrial presystolic... |
view large |
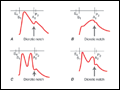 | Figure 227-2 Schematic diagrams of the configurational changes in carotid pulse and their differential diagnoses. Heart sounds are also illustrated. A. Normal. S4, fourth heart sound; S1, first... |
view large |
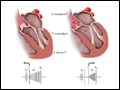
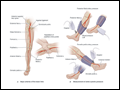 | Figure 227-3 A. Anatomy of the major arteries of the leg. B. Measurement of the ankle systolic pressure. (From NA Khan et al: JAMA... |
view large |
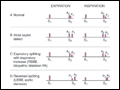 | Figure 227-4 Heart sounds. A. Normal. S1, first heart sound; S2, second heart sound; A2, aortic component of the second heart sound; P2, pulmonic component of the second heart sound. B. Atrial septal defect with fixed... |
view large |
 | Figure 227-5 A. Top. Graphic representation of the systolic pressure difference (green shaded area) between left ventricle and left atrium with phonocardiographic recording of a holosystolic murmur (HSM) indicative... |
view large |
 | Figure 227-6 Behavior of the click (C) and murmur (M) of mitral valve prolapse with changes in loading (volume, impedance) and contractility. S1, first heart sound; S2, second heart sound. With standing (left side of figure), volume and impedance decrease, as a result of which the click and murmur move closer to... |
view large |