

PART 10: Disorders of the Cardiovascular System
SECTION 1 Introduction to Cardiovascular Disorders
224 Basic Biology of the Cardiovascular System
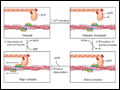
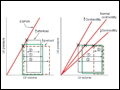
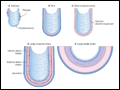 | Figure 224-1 Schematics of the structures of various types of blood vessels. A. Capillaries consist of an endothelial tube in contact with a discontinuous population of pericytes. B. Veins typically have thin medias and thicker adventitias.... |
view large |
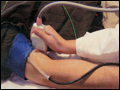 | Figure 224-2 Assessment of endothelial function in vivo using blood pressure cuff-occlusion and release. Upon deflation of the cuff, changes in diameter (A) and blood flow (B) of the brachial artery are monitored with an... |
view large |
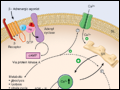
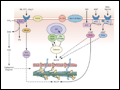 | Figure 224-3 Regulation of vascular smooth-muscle cell calcium concentration and actomyosin ATPase-dependent contraction. AC, adenylyl cyclase; Ang II, angiotensin II; ANP, antrial natriuretic peptide; DAG, diacylglycerol; ET-1, endothelin-1; G, G-protein; IP3, inositol 1,4,5-trisphosphate; MLCK, myosin light chain kinase; MLCP, myosin light chain phosphatase; NE,... |
view large |
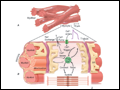 | Figure 224-4 A shows the branching myocytes making up the cardiac myofibers. B illustrates the critical role played by the changing [Ca2+] in the myocardial cytosol. Ca2+ ions are schematically shown as entering through the calcium channel that... |
view large |
 | Figure 224-5 Four steps in cardiac muscle contraction and relaxation. In relaxed muscle (upper left), ATP bound to the myosin cross-bridge dissociates the thick and thin filaments. Step... |
view large |
 | Figure 224-6 Signal systems involved in positive inotropic and lusitropic (enhanced relaxation) effects of β-adrenergic stimulation. When the β-adrenergic agonist interacts with the β receptor, a series of G protein–mediated changes... |
view large |
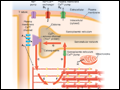 | Figure 224-7 The Ca2+ fluxes and key structures involved in cardiac excitation-contraction coupling. The arrows denote the direction of Ca2+ fluxes. The thickness of each arrow indicates the magnitude of the calcium flux. Two Ca2+ cycles regulate... |
view large |
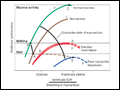 | Figure 224-8 The interrelations among influences on ventricular end-diastolic volume (EDV) through stretching of the myocardium and the contractile state of the myocardium. Levels of ventricular EDV associated with filling pressures that result in dyspnea and pulmonary edema are shown on the... |
view large |
 | Figure 224-9 Interactions in the intact circulation of preload, contractility, and afterload in producing stroke volume. Stroke volume combined with heart rate determines cardiac output, which, when combined with peripheral vascular resistance, determines arterial pressure for tissue... |
view large |
 | Figure 224-10 The responses of the left ventricle to increased afterload, increased preload, and increased and reduced contractility are shown in the pressure-volume plane. Left. Effects of increases in preload and... |
view large |
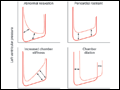 | Figure 224-11 Mechanisms that cause diastolic dysfunction reflected in the pressure-volume relation. The bottom half of the pressure-volume loop is depicted. Solid lines represent normal subjects; broken lines represent patients with diastolic dysfunction. (From... |
view large |
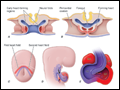 | Figure 224-12 A. Schematic depiction of a transverse section through an early embryo depicts the bilateral regions where early heart tubes form. B. The bilateral heart tubes... |
view large |