

PART 7: Oncology and Hematology
SECTION 1 Neoplastic Disorders
83 Cancer Genetics
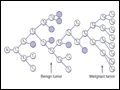 | Figure 83-1 Multistep clonal development of malignancy. In this diagram a series of five cumulative mutations (T1, T2, T4, T5, T6), each with a modest growth advantage acting alone, eventually results in a malignant tumor. Note that not all such alterations result in progression; for example, the T3 clone is a dead end. The actual number of... |
view large |
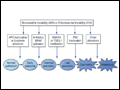 | Figure 83-2 Progressive somatic mutational steps in the development of colon carcinoma. The accumulation of alterations in a number of different genes results in the progression from normal epithelium through adenoma to full-blown carcinoma. Genetic instability (microsatellite or chromosomal) accelerates the progression by increasing the... |
view large |
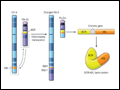 | Figure 83-3 Specific translocation seen in chronic myelogenous leukemia (CML). The Philadelphia chromosome (Ph) is derived from a reciprocal translocation between chromosomes 9 and 22 with the breakpoint joining the sequences of the ABL oncogene with the BCR gene. The fusion of these DNA... |
view large |
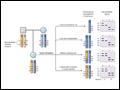 | Figure 83-4 Diagram of possible mechanisms for tumor formation in an individual with hereditary (familial) retinoblastoma. On the left is shown the pedigree of an affected individual who has inherited the abnormal (Rb) allele from her affected mother. The normal allele is shown as a (+). The four chromosomes of her two parents are drawn to... |
view large |
 | Figure 83-5 Germline and somatic mutations in the tumor-suppressor gene APC. APC encodes a 2843-amino-acid protein with 6 major domains: an oligomerization region (O), armadillo repeats (ARM), 15-amino-acid repeats (15 aa), 20-amino-acid repeats (20 aa), a basic region, and a domain... |
view large |
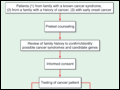 | Figure 83-6 Algorithm for genetic testing in a family with cancer predisposition. The key step is the identification of a mutation in a cancer patient, which allows testing of asymptomatic family members. Asymptomatic family members who test positive may require increased screening or surgery, whereas others are at no greater risk for... |
view large |
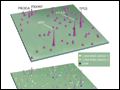
 | Figure 83-7 A microarray experiment. RNA is prepared from cells, reverse transcribed to cDNA, and labeled with fluorescent dyes (typically green for normal cells and red for cancer cells). The fluorescent probes are mixed and hybridized to a cDNA array. Each spot on the array is an oligonucleotide (or cDNA fragment) that represents a... |
view large |
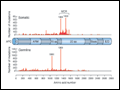
 | Figure 83-8 A two-dimensional maps of genes mutated in colo-rectal cancer. The two-dimensional landscape represent the positions of the RefSeq genes along the chromosomes and the height of the peaks represent the mutation frequency. On the top map, the taller peaks represent the genes that are commonly mutated in colon cancer while the... |
view large |