

PART 5: Aging
72 Clinical Problems of Aging
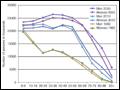 | Figure 72-1 Change in the structure of the U.S. population between 1960 and 2050. (From United Nations World Population Prospects: The 2008 Revision, http://esa.un.org/unpp.) |
view large |
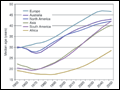 | Figure 72-2 Population aging in different geographic regions. (From United Nations World Population Prospects: The 2008 Revision, http://esa.un.org/unpp.) |
view large |
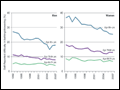
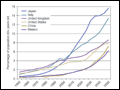 | Figure 72-3 Percentage of the population age >80 years from 1950 to 2050 in different representative nations. The pace of aging will accelerate. (From United Nations World Population Prospects: The 2008 Revision, http://esa.un.org/unpp.) |
view large |
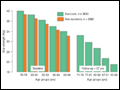
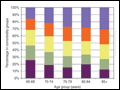 | Figure 72-4 Prevalence of comorbidity by age group in persons 65 years and older living in the U.S. and enrolled in Medicare parts A and B in 1999. (From JL Wolff et al: Arch Intern Med 162:2269, 2002.) |
view large |
 | Figure 72-5 Self-reported prevalence of disability (severe difficulty) in bathing/showering between 1992 and 2007, according to age and sex. (From Medicare Current Beneficiary Survey 1992–2007. Accessed May 26, 2010 at http://205.207.175.93/HDI/TableViewer/.) |
view large |
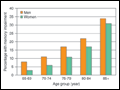 | Figure 72-6 Rates of memory impairments in different age groups. The definition of "moderate or severe memory impairment" is 4 or fewer words recalled out of 20. (Source: Health and Retirement Survey. Accessed February 7, 2011 at http://aoa.gov/agingstatsdotnet/Main_Site/Data/2000_Documents/healthstatus.aspx.) |
view large |
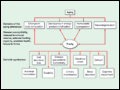 | Figure 72-7 A unifying model of aging, frailty, and the geriatric syndromes. |
view large |
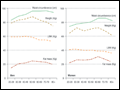 | Figure 72-8 Longitudinal changes of weight, body composition, and waist circumference over the life span estimated in 1167 participants of the Baltimore Longitudinal Study of Aging. *Lean Body Mass (LBM) and Fat Mass estimated with DEXA. [Source: The Baltimore Longitudinal study of Aging 2010 (unpublished data).] |
view large |
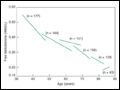
 | Figure 72-9 Cross-sectional differences and longitudinal changes in muscle strength over a 27-year follow-up. Note that subjects who died during the follow-up had lower baseline muscle strength. (From T Rantanen et al: J Appl Physiol 85:2047, 1998.) |
view large |
 | Figure 72-10 Longitudinal changes in aerobic capacity in participants of the Baltimore Longitudinal Study of Aging. (From JL Fleg: Circulation 112:674, 2005.) |
view large |
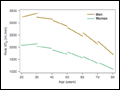
 | Figure 72-11 Changes in resting metabolic rate with aging. [Data from the Baltimore Longitudinal Study of Aging (unpublished).] |
view large |
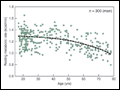
 | Figure 72-12 Longitudinal changes of free testosterone levels in healthy men. (From SM Harman et al: J Clin Endocrinol Metab 86:724, 2001.) |
view large |
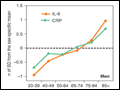 | Figure 72-13 Change in IL-6 and c-reactive protein with aging. *Values are expressed as Z-Scores to make them comparable. (From L Ferrucci et al: Blood 105:2294, 2005.) |
view large |
 | Figure 72-14 Five-year decline in mean volumes measured in standard deviation units (Cohen's d) of different brain regions. The primary visual cortex shows the smallest average shrinkage and the prefrontal and inferior parietal cortex and hippocampus showed the highest average shrinkage. (From N Raz et al: Ann N Y Acad Sci 1097:84,... |
view large |
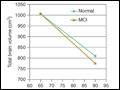 | Figure 72-15 Longitudinal changes of regional brain volumes in normal aging and MCI. (From I Driscoll et al: Neurology 72:1906, 2009.) |
view large |
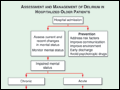 | Figure 72-16 Algorithm depicting assessment and management of delirium in hospitalized older patients. (Modified from SK Inouye: N Engl J Med 354:1157, 2006.) |
view large |
 | Figure 72-17 Algorithm depicting assessment and management of falls in older patients. (From American Geriatrics Society and British Geriatrics Society: Clinical Practice Guideline for the Prevention of Falls in Older Persons. New York, American Geriatric Society, 2010.) |
view large |
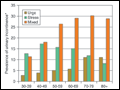 | Figure 72-18 Rates of urge, stress and mixed incontinence by age group in a sample of 3552 women. *Based on a sample of 3553 participants. (From JL Melville et al: Arch Intern Med 165:537, 2005.) |
view large |