

PART 5: Aging
70 World Demography of Aging
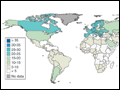 | Figure 70-1 Percentages of national populations aged 60+, in 2010. (From the US Census Bureau, International Database. StatPlanet Mapping Software.) |
view large |
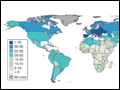 | Figure 70-2 Percentages of national populations aged 60 +, in 2050 (projections). (From the US Census Bureau, International Database. StatPlanet Mapping Software.) |
view large |
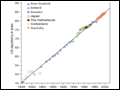 | Figure 70-3 Life expectancy in most advanced nations, 1800-2000, females. (From J Oeppen, JW Vaupel: Science 296:1029, 2002.) |
view large |
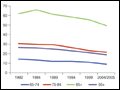 | Figure 70-4 Disability prevalence, various years 1982-2005, by age group over 65, United States. (Adapted from KG Manton et al: Proc Natl Acad Sci U S A. 103:18374, 2006.) |
view large |
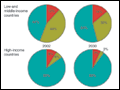 | Figure 70-5 Leading causes of burden of illness in world regions 2002 and projected for 2030. (Adapted from Mathers and Loncar.) |
view large |