

PART 1: Introduction to Clinical Medicine
3 Decision-Making in Clinical Medicine
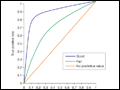 | Figure 3-1 Each ROC curve illustrates a trade-off that occurs between improved test sensitivity (accurate detection of patients with disease) and improved test specificity (accurate detection of patients without disease), as the test value defining when the test turns from "negative" to "positive" is varied. A 45° line would indicate a test with no predictive... |
view large |
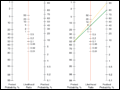 | Figure 3-2 Nomogram version of Bayes' theorem used to predict the posttest probability of disease (right-hand scale) using the pretest probability of disease (left-hand scale) and the likelihood ratio for a positive test (middle scale). See text for information on calculation of likelihood ratios. To use, place a straightedge connecting the pretest probability and... |
view large |
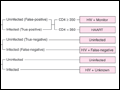 | Figure 3-3 Basic structure of decision model used to evaluate strategies for screening for HIV in the general population. HIV, human immunodeficiency virus; HAART, highly active antiretroviral therapy. (Provided courtesy of G. Sanders, with permission.) |
view large |